What Causes Dips in Exoplanet Reflected Light Curves
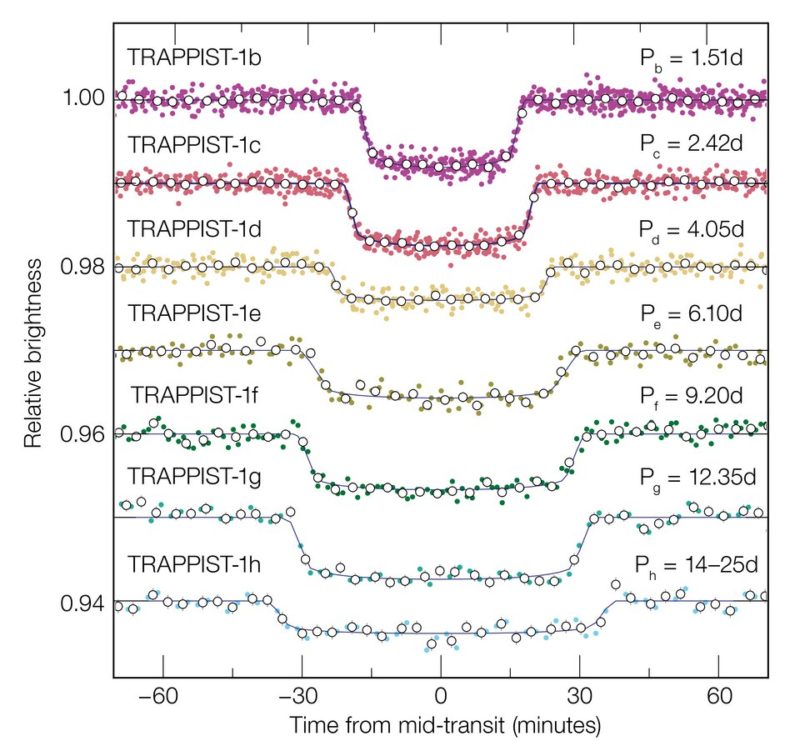
Unexpected dips in an exoplanet reflected light phase curve usually mean one of two things: the planet really is getting dimmer at a particular orbital phase because its atmosphere, clouds, or surface map is uneven, or the signal is being polluted by heat, stellar variability, or the instrument itself. That is the short answer.
The deeper answer is messier, because a phase curve is never just “planet shiny, then less shiny.” It is a blended measurement of the star plus planet system, shaped by viewing angle, scattering physics, orbital geometry, and whatever the host star is doing that day.
That is why exoplanet people rarely trust a single photometric wiggle on first sight. A dip can carry real climate information, especially for hot Jupiters and other strongly irradiated atmospheres, but it can also be a false clue. In practice, the useful science comes from separating reflected starlight from thermal phase variations, then checking whether the pattern survives every ugly test you can throw at it.
What does a normal phase curve show?
A normal phase curve is the changing brightness of the combined star and planet as the planet moves through its phases, much like Venus does from our point of view, except here the world is unresolved and the signal is tiny. For a circular orbit, the standard phase convention puts transit near phase 0 and secondary eclipse near phase 0.5.
Reflected light
Reflected light rises when more of the dayside swings into view and falls when less of it does. If the planet were a bland Lambertian sphere with uniform planetary albedo, the curve would be smooth and roughly symmetric. Real atmospheres laugh at that assumption.
Phase angle
The phase angle controls how much illuminated area the observer sees. Small angles near “full phase” generally mean more reflected flux. Large angles reveal more limb regions, where scattering can behave very differently, especially in hazy or cloud-rich exoplanet atmosphere models.
Secondary eclipse
The cleanest dip is the secondary eclipse, when the planet passes behind the host star and its reflected light vanishes from the data. If you want a simple visual, this explanation of secondary eclipse variations gets the geometry across without much drama.
A normal reflected-light curve, then, tends to include a few expected ingredients:
- a gradual brightening as the hot day side rotates into view
- a maximum near full phase, unless clouds or circulation shift it
- an abrupt drop at secondary eclipse
- a recovery after eclipse as the planet reappears
What causes a true brightness dip?
A true dip means the planet itself is responsible. Not the telescope. Not a spotted star. The world.
Clouds and haze
Clouds are the usual troublemakers. Patchy condensates, silicate clouds, metallic hazes, and high-altitude aerosols can make one longitude dazzling and the next oddly dull. That can produce local depressions in the phase curve, especially if bright cloud decks sit away from the substellar longitude or if forward scattering changes with angle. Work on haze and atmospheric structure has also shown that refraction and transparency effects can create features that are not obvious in a toy model.
Dark surface maps
For rocky planets, or giant planets with strong albedo maps, dark regions rotating into view can carve a notch into the reflected-light signal. Scientists sometimes describe these brightness patterns with spherical harmonics or a spherical harmonic albedo map, which sounds abstract until you realize it is just a disciplined way of drawing a planetary coordinate system from light alone. A mosaic, not a snapshot.
Orbital geometry
Even a uniform planet can look strange if the orbit is eccentric, the orbital inclination is not favorable, or the planetary obliquity tilts bright zones in and out of sight. In a non-circular orbit, the incoming flux changes with star-planet distance, so reflected brightness can lurch around periastron instead of following a neat, symmetric arc.
How do clouds shift the pattern?
Clouds do not merely brighten things. They move the timing.
Patchy cover
Patchy cover shifts the brightest and darkest longitudes. Kepler-7b became famous because the optical brightness map suggested cloud asymmetry rather than simple heat redistribution. That mattered. It told people that phase curves were not just for detecting planets, but for characterising exoplanet satellite-free atmospheres and their weather.
Scattering phase
Some particles backscatter efficiently, others forward scatter. That changes the phase dependence. A dip can show up not because the planet has fewer clouds, but because the scattering phase function makes those clouds less effective at a specific viewing angle.
Day-night contrast
Tidally locked hot Jupiters often have savage day-night contrast. If the dayside is partly clouded and the nightside is dark, the transition between them can bend the curve in ways that look offbeat until a 3D general circulation model is fitted. WASP-43 b and WASP-33b are useful reminders that atmospheric circulation and irradiation temperature matter as much as raw albedo.
When is heat not reflection?
Optical light curves often contain both reflected starlight and the planet’s own thermal emission. For a very hot planet, especially a hot jupiter, the split is not optional. You have to model both.
Thermal emission
Thermal emission comes from the planet radiating its own energy. In the optical, that can still matter for very hot day side temperatures. In the infrared, it often dominates. If you mistake thermal light for reflection, the inferred planetary albedo will be wrong, sometimes wildly wrong.
Hotspot offset
Atmospheric superrotation can push the hottest region east of the substellar point. That creates a phase curve offset, where the thermal maximum arrives earlier or later than simple geometry predicts. It is a classic source of confusion.
Wavelength tests
This is where scientists get practical.
| Signal clue | More likely reflection | More likely heat |
|---|---|---|
| Strong in blue optical | Yes, often | Rare |
| Strong in infrared | Weak to moderate | Yes |
| Sharp dependence on cloud map | Yes | Sometimes |
| Offset tied to wind-driven hotspot | Possible | Very common |
Multi-band observations are the sanity check. If the dip changes dramatically with wavelength, that betrays atmospheric composition, cloud opacity, or thermal contamination rather than a purely geometric effect.
How do scientists rule out false dips?
They get suspicious. Properly suspicious.
Stellar activity
Starspots, faculae, rotation, and flares can fake phase variations. The nasty part is that the host star can vary on timescales similar to the orbit. Not every dip belongs to the planet.
Instrument bias
Detrending choices, thermal settling in the telescope, pointing drift, and correlated noise can imprint false asymmetries. Kepler, HST, Spitzer, CHEOPS, TESS, and JWST all need instrument-specific systematics treatment. Fancy technology helps, but bias still sneaks in through the back door.
Model checks
Researchers usually cross-check with a few methods:
- fit reflected-only and reflected-plus-thermal models
- test whether the dip repeats over many orbits
- compare optical and infrared phase curves
- include stellar variability terms, often with Gaussian processes
If the feature survives that gauntlet, confidence rises.
What can orbit geometry change?
Quite a lot, actually. An inclined orbit changes how much of the illuminated hemisphere is visible. Eccentricity changes the stellar forcing across the orbit. Planetary obliquity can move seasonal bright zones, though that is harder to recover. Even more exotic ideas, like oblateness or rings, can distort the phase curve method enough to mimic a dip. That is why no serious group interprets geometry in isolation from climate.
What can these signals reveal next?
The exciting part is that these dips are not just nuisances. They can reveal cloud chemistry, heat redistribution, night temperature structure, and global circulation. They can even show which planets are dynamically tame and which belong to the cosmic Rube Goldberg school of system architecture, where migration, resonances, and long-term interactions sculpt everything. Phase curves are one piece of that broader puzzle, sitting beside radial velocities, transit timing variations, astrometry, and, if we are lucky, direct imaging.
FAQ
Are unexpected dips always bad data?
No. Some are real atmospheric or geometric features. Some are junk. The whole job is figuring out which is which.
Is secondary eclipse an unexpected dip?
Usually no. It is an expected occultation feature in a well-understood orbit. The “unexpected” part is when extra dips or asymmetries appear outside that event.
Do clouds always make a planet brighter?
Not necessarily. Clouds can brighten one longitude, dim another, and shift the peak depending on particle size, altitude, and scattering behavior.
Conclusion
Unexpected dips in an exoplanet reflected light phase curve come from uneven reflection, cloud and haze physics, dark albedo maps, and orbital geometry, but they can also be fakes created by heat, stars, or instruments. The hard part, and honestly the fun part of modern science, is learning which explanation survives multi-wavelength observations, repeat measurements, and physically consistent models. That is where the real insights live, and a lot of that discovery is now free to explore in public data, which is one of the better kinds of innovation.
Would you like to receive similar articles by email?

Paul Tomaszewski
Paul Tomaszewski is a science & tech writer as well as a programmer and entrepreneur. He is the founder and editor-in-chief of CosmoBC. He has a degree in computer science from John Abbott College, a bachelor's degree in technology from the Memorial University of Newfoundland, and completed some business and economics classes at Concordia University in Montreal. While in college he was the vice-president of the Astronomy Club. In his spare time he is an amateur astronomer and enjoys reading or watching science-fiction. You can follow him on LinkedIn and Twitter.


You May Also Like
How Did Asteroid Hygiea Get Its Name
Stargazing Calendar for September 2025